

FBI Releases 2014 Hate Crime Statistics
Today, the FBI released Hate Crime Statistics, 2014, the Uniform Crime Reporting (UCR) Program’s latest compilation about bias-motivated incidents throughout the nation. Submitted by 15,494 law enforcement agencies, the data provide information about the offenses, victims, offenders, and locations of hate crimes; however, the UCR Program does not estimate offenses for the jurisdictions of agencies that do not submit reports. Highlights of Hate Crime Statistics, 2014 follow.
- Law enforcement agencies submitted incident reports involving 5,479 criminal incidents and 6,418 offenses as being motivated by bias toward race, gender, gender identity, religion, disability, sexual orientation, and ethnicity in 2014. The numbers are down from 2013 when 5,928 criminal incidents were reported involving 6,933 offenses.
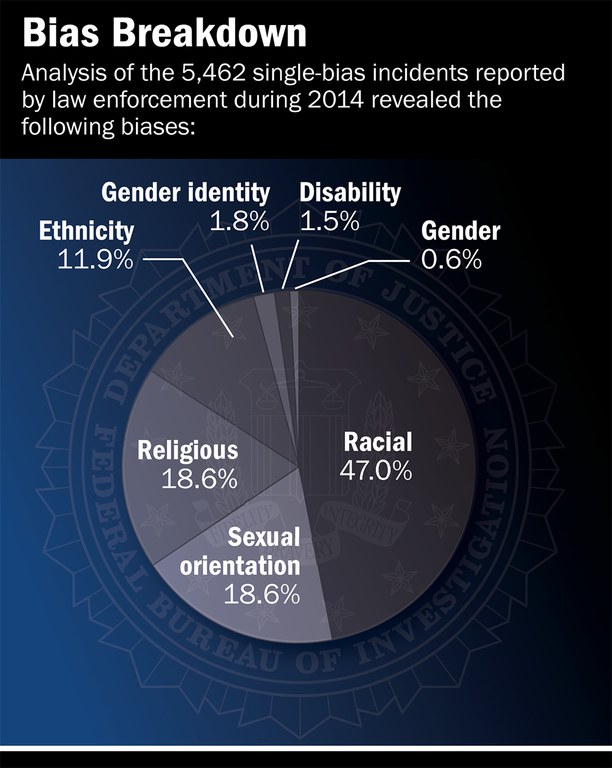
- There were 5,462 single-bias incidents involving 6,681 victims. A percent distribution of victims by bias type showed that 48.3 percent of victims were targeted because of the offenders’ racial bias, 18.7 percent were victimized because of the offenders’ sexual-orientation bias, 17.1 percent were targeted because of the offenders’ religious bias, and 12.3 percent were victimized due to ethnicity bias. Victims targeted because of the offenders’ bias against gender identity accounted for 1.6 percent of victims of single-bias incidents; disabilities, 1.4 percent; and gender, 0.6 percent.
- There were 17 multiple-bias hate crime incidents involving 46 victims.
- Of the 4,048 hate crime offenses classified as crimes against persons in 2014, intimidation accounted for 43.1 percent, simple assault accounted for 37.4 percent, and aggravated assault for 19.0 percent. Four murders and nine rapes (all nine from agencies that collected data using the revised rape definition) were reported as hate crimes.
- Beginning with the 2013 data collection, the UCR Program’s revised definition of rape is “Penetration, no matter how slight, of the vagina or anus with any body part or object, or oral penetration by a sex organ of another person, without the consent of the victim.” [This includes the offenses of rape, sodomy, and sexual assault with an object as converted from data submitted via the National Incident-Based Reporting System (NIBRS).]
- The UCR Program’s legacy definition of rape is “The carnal knowledge of a female forcibly and against her will.”
- There were 2,317 hate crime offenses classified as crimes against property. The majority of these (73.1 percent) were acts of destruction/damage/vandalism. Robbery, burglary, larceny-theft, motor vehicle theft, arson, and other offenses accounted for the remaining 26.9 percent of crimes against property.
- In the UCR Program, the term known offender does not imply that the suspect’s identity is known; rather, the term indicates that some aspect of the suspect was identified, thus distinguishing the suspect from an unknown offender. Law enforcement agencies specify the number of offenders and, when possible, the race of the offender or offenders as a group. Beginning in 2013, law enforcement officers could also report whether suspects were juveniles or adults, as well as the suspect’s ethnicity when possible.
- Of the 5,192 known offenders, 52.0 percent were white, and 23.2 percent were black or African-American. The race was unknown for 16.0 percent. Other races accounted for the remaining known offenders: 1.1 percent were American Indian or Alaska Native; 0.8 percent were Asian; less than 0.1 percent were Native Hawaiian or Other Pacific Islander; and 6.9 percent were of a group of multiple races.
- Of the 1,875 offenders for whom ages were known, 81.0 percent were 18 years of age or older.
- Of the 975 offenders for whom ethnicity was reported, 47.6 percent were Not Hispanic or Latino, 6.5 percent were Hispanic or Latino, and 1.7 percent were in a group of multiple ethnicities. Ethnicity was unknown for 44.2 percent of these offenders.
• Most hate crime incidents (31.6 percent) occurred in or near residences/homes. Nearly 18 percent (17.8) occurred on highways/roads/alleys/streets/sidewalks; 8.6 percent occurred at schools/colleges; 6.3 percent happened at parking/drop lots/garages; and 3.6 percent took place in churches/synagogues/temples/mosques. The location was considered other/unknown for 11.9 percent of hate crime incidents. The remainder of hate crime incidents took place at other specified or multiple locations.
Report Contains Info on Offenses, Victims, and Offenders
According to the FBI’s latest report, law enforcement agencies reported 5,479 hate crime incidents involving 6,418 offenses to our Uniform Crime Reporting (UCR) Program in 2014. And these crimes—which often have a devastating impact on the communities where they occur—left 6,727 victims in their wake.
The latest figures are down from 2013, when 5,928 criminal incidents involving 6,933 offenses were reported.
Hate Crime Statistics, 2014 provides information about the offenses, victims, and offenders. Among some of the highlights:
More Read

- Of the 5,462 single-bias incidents reported in 2014, 47 percent were racially motivated. Other motivators included sexual orientation, religion, ethnicity, gender identity, disability, and gender. (See above chart.)
- Of the 6,418 reported hate crime offenses, 63.1 percent were crimes against persons and 36.1 percent were crimes against property. The remaining offenses were crimes against society, like illegal drug activity or prostitution.
- The majority of the 4,048 reported crimes against persons involved intimidation (43.1 percent) and simple assault (37.4 percent).
- Most of the 2,317 hate crimes against property were acts of destruction, damage, and vandalism (73.1 percent).
- Individuals were overwhelmingly the most common victim of a single-bias hate crime, accounting for 82.4 percent of the reported 6,418 offenses. The remaining victim types were businesses, financial institutions, religious organizations, government, and society or the public.
- Also during 2014, law enforcement agencies reported 5,192 known offenders in 5,479 bias-motivated incidents. (In the UCR Program, “known offender” does not imply that the suspect’s identity is known, only that some aspect of the suspect was identified by a victim or witness—such as race, ethnicity, or age.)
And while 15,494 law enforcement agencies contributed to UCR’s Hate Crime Statistics report in 2014, only 1,666 agencies reported hate crimes within their jurisdiction (the remaining agencies reported zero hate crimes).
To enhance the accuracy of hate crime reporting, representatives from the UCR Program participated in five hate crime training sessions provided jointly by the Department of Justice (DOJ) and the FBI. Since April 2015, DOJ and the FBI provided the training sessions to law enforcement agencies and community groups in several different areas of the county. UCR personnel also worked with states to ensure proper data submission and met with police agencies to provide training and discuss crime reporting issues.
In addition to releasing annual Hate Crime Statistics reports, which give the nation a clearer picture of the overall crime problem, the FBI also investigates incidents of hate crimes—as a matter of fact, it’s the number one priority within our civil rights program. We investigate hate crimes that fall under federal jurisdiction, assist state and local authorities during their own investigations, and in some cases—with the DOJ’s Civil Rights Division—monitor developing situations to determine if federal action is appropriate.
The 2016 release of the Hate Crimes Statistics report, which will contain 2015 data, will feature even more information—expanded bias types in the religion category and the added bias type of anti-Arab under the race/ethnicity/ancestry category. The collection of both types of data began in January 2015.


